View tracker
The view tracker tool records the viewer as the user navigates over an image, similar to a screen recorder.
Note
The view tracker currently requires the image being recorded to be within a project as the recordings are saved in the projects folder. When sharing, be sure to share the whole project folder.
How to use
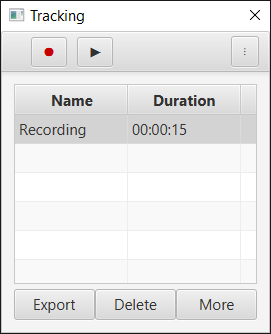
It can be accessed via and looks like this:

View tracker user interface including an example view record
All the recordings of the currently opened image are listed here.
Create a recording
To start a new recording of the viewer, simply click ![]() . To stop
the recording, click
. To stop
the recording, click ![]() . After stopping a recording, QuPath will
automatically save it as a TSV file within in the project folder.
. After stopping a recording, QuPath will
automatically save it as a TSV file within in the project folder.
Tip
You can also add mouse and active tool tracking to the recording by clicking the three dots icon.
Playback
You can replay any selected recording by selecting it and using the  button.
Warning
A recording can only be made for one viewer at a time. I.e. You cannot jump from one viewer to another during a recording, even in multi-view. Doing so will simply stop the current recording.
Analyze
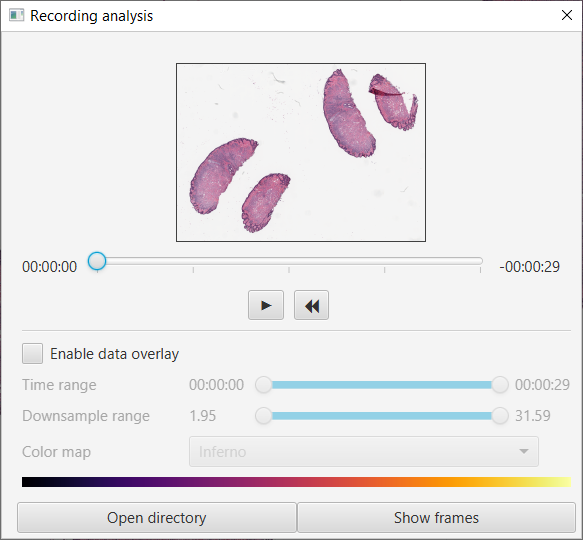
The Analysis pane gives the user an overview of the recording by showing where the viewer is looking at each time point and how long that area been looked at. To analyze a recording, select it and click Analyze or double-click on the recording. This will run the analysis pane, as shown:

View tracker analysis pane
Playbacks can be replayed by clicking the  button with a few additional options discussed below.
Data overlay
This uses a heatmap overlay which the colors can be changed via the colormap option. It provides an insight into areas of focus during the recording and is determined by time spent looking at that region. To activate this option, select Enable data overlay. Each colored pixel of the overlay represents the amount of milliseconds spent on the corresponding pixel of the original image.
Time range and downsample range
You can dynamically crop the recording to display only the data from a certain period of the recording by sliding the Time range slider (e.g. only the frames between 5 minutes and before 10 minutes). Similarly, you can dynamically crop the recording to only display the data from the frames which were captured in a specified downsample range (e.g. only the frames where the image was viewed as full resolution).
Tip
You can export the overlay to a tif file by right-clicking on the slide overview (after making sure that Enable data overlay is ticked), then Export data as TIF.
Recording table
As mentioned above, all recordings are automatically saved as a TSV file in the project folder. You can preview this table by clicking Show frames (and Hide frames to collapse them).
Note
Selecting a recording from the previewed table will automatically change the position of the current viewer to match the frame selected.